

Organizations that fail to embrace data analytics make blind decisions, struggling to optimize delivery and maintain quality. Without real-time insights, inefficiencies persist, resources are misallocated, and teams face difficulty identifying the root causes of delays. This lack of visibility creates friction, slows decision-making, and negatively impacts business outcomes.
For our Client, ensuring high-quality delivery across multiple teams and projects had become increasingly complex. Without a centralized performance-tracking system, bottlenecks went unnoticed, delays accumulated, and opportunities for improvement were missed. By implementing a robust data-driven dashboard, our Client transformed operations—gaining real-time insights to proactively address issues, allocate resources efficiently, and make strategic decisions.
This article explores how our Client leveraged data analytics, automation, and custom software solutions to drive measurable improvements in delivery, quality engineering, and overall efficiency.
Our partnership with our Client began in 2018 with a small team of Quality Engineers (QEs). Initially a modest engagement, it grew substantially due to strategic leadership and stakeholder support. By 2023, the team had expanded to over 150 members across multiple locations, contributing to 20+ projects, including an AWS migration.
However, managing multiple teams, ensuring process consistency, and tracking delivery quality presented significant challenges. A more structured, data-driven approach became essential.
Recognizing the need for systematic performance tracking, we introduced Quarterly Business Reviews (QBRs) in early 2023. Initially reliant on manual data collection, this process was time-consuming and inefficient. To address this, we developed a comprehensive custom dashboard that automated data collection, visualization, and analytics, streamlining performance evaluations.
Challenge
Description
Solution
Lack of standardization
Different teams had varying Scrum processes and JIRA configurations, making data consolidation difficult.
A flexible data engineering query system extracted standardized information from JIRA, ensuring reporting consistency.
Manual Data Handling
Initial data extraction and visualization were manual, leading to inefficiencies.
JIRA API integrations and automation scripts eliminated repetitive tasks, accelerating data analysis.
Low Visibility into Quality Issues
Teams struggled to identify recurring quality issues before they became major blockers.
The dashboard incorporated defect analysis, tracking both customer-facing and internal defects along with resolution timelines.
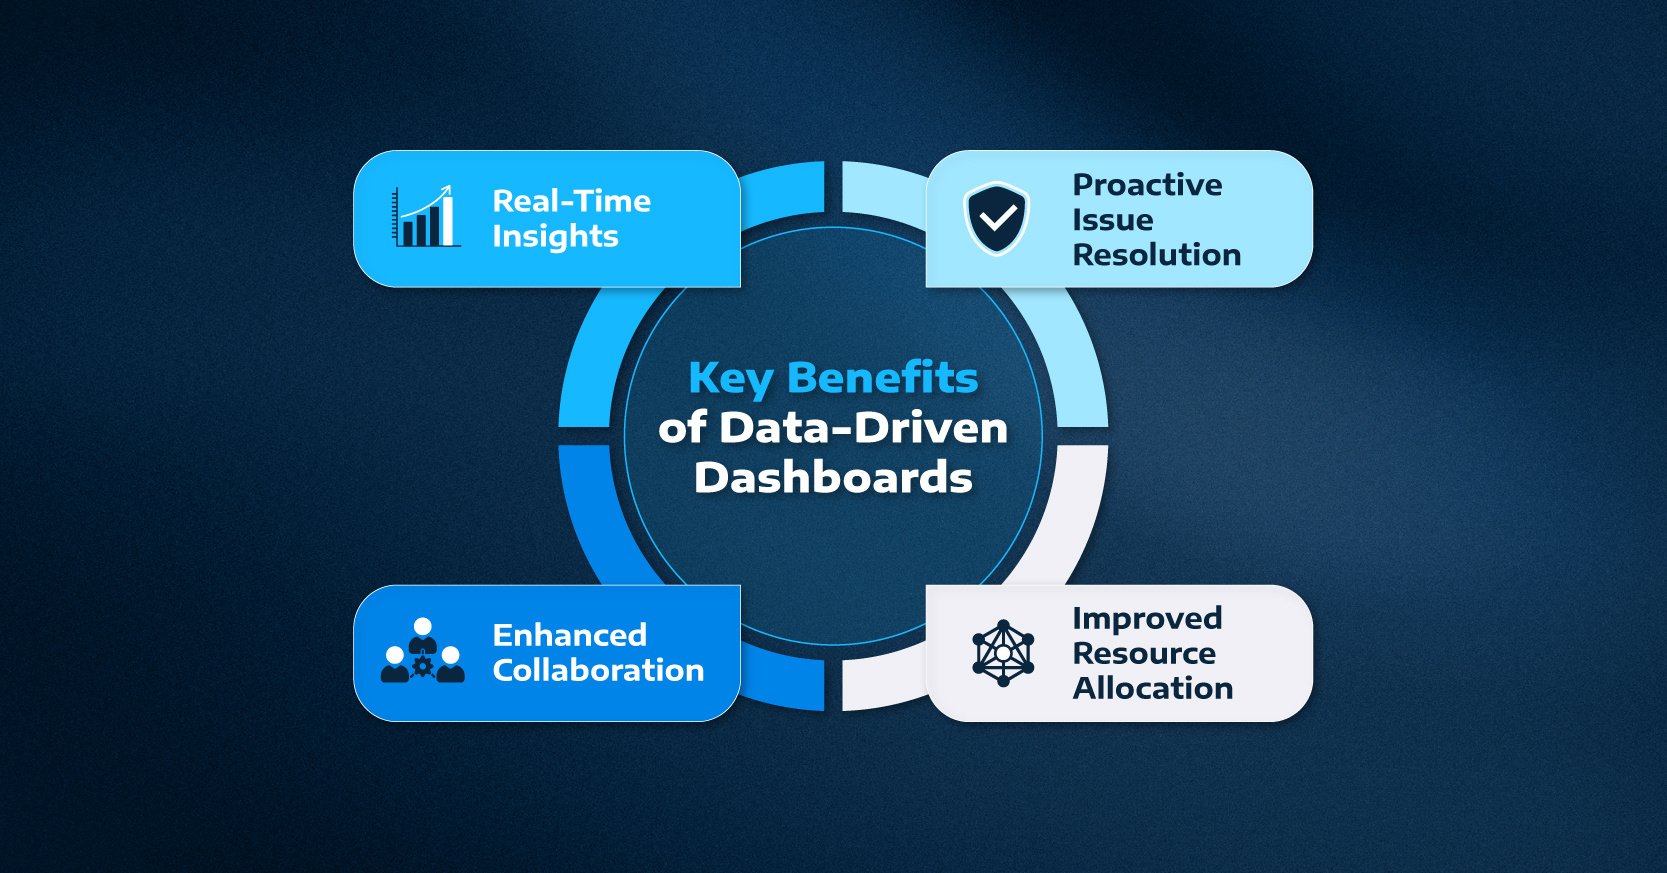
The custom dashboard provides a consolidated view of key performance metrics, including:
By visualizing these insights, teams can proactively address inefficiencies. For instance, discovering that a high percentage of bugs were customer-reported led to a review of QA practices to enhance pre-release testing.
The success of this initiative has driven interest in expanding it across engagements. The ability to present clear, data-backed insights has enabled our Client to refine processes at scale.
Moving forward, our Client aims to enhance forecasting and decision-making by integrating AI-driven analytics into the dashboard. Their ultimate goal is to develop a scalable data engineering framework that benefits all teams through data-driven decision-making.
Building an effective delivery and quality tracking system requires continuous iteration. By leveraging automation, strategic data visualization, and custom software development, our Client has significantly improved transparency and efficiency. The journey doesn’t stop here—new enhancements will further elevate their data analytics capabilities.
Want to optimize your delivery and quality processes? Let’s connect and explore how we can collaborate!


Let's talk about where you are today and where you want to go - our experts are ready to help you move forward.